 To the home page
EasyStrain should be launched with three arguments that are file names:
easystrain2d.exe struct.txt input.dat output.dat
or
easystrain3d.exe struct.txt input.dat output.dat
(of course, any other names can be used for files).
The first argument (struct.txt in our example) is a name of a file from which the program reads information about the structure to be calculated: shape, size and position of an inclusion, lattice mismatch, Poisson's ratio.
The second argument (input.dat) is a name of a file containing coordinates of the points in which the strain tensor should be calculated.
The third argument (output.dat) is a name of a file to which the program writes the calculation results.
Structure of the files is somewhat different in two- and three-dimensional cases. We will consider them separately.
File struct.txt can look like this:
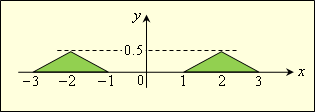
_[ Example: two triangular inclusions aligned horizontally _] _[ (see the picture below). _] _vertices 6 _[ Total number of vertices. _] @ 1 0 _[ After the symbol @, x- and y-coordinates of a vertex are written. _] @ 3 0 _[ For each inclusion, vertices should come in order _] @ 2 0.5 _[ (either clockwise or counter-clockwise). _] @@ _[ The symbol @@ separates vertices belonging to dirrefent inclusions. _] @ -3 0 _[ If there is only one inclusion, the symbol @@ is not necessary. _] @ -1 0 @ -2 0.5 _eps0 0.04 _[ Lattice mismatch _] _Poisson 0.25 _[ Poisson ratio _] _end After the word "_end", any text may be written---it will be ignored. The file consists of words separated by whitespaces, tabs, end-of-lines. It does not matter how many whitespaces, etc. are placed between words. It is not important also how the file is broken into lines. Comments can be inserted in any place of file. Each comment begins with the word "_[", and ends with the word "_]". Coordinates can be measured in any units (centimeters, nanometers and so on), the choice of units does not influence on the result (because strain tensor is dimensionless). Lattice mismatch is defined as (A_inclusion - A_matrix) / A_matrix, where A_inclusion and A_matrix are lattice constants of the inclusion and the matrix. |

File input.dat contains two columns of numbers. The first column is x-coordinates of points, the second is y-coordinates. Each row corresponds to one point (x,y), where strain tensor is to be calculated. For example:
0.85 -0.15 0.85 -0.05 0.85 0.05 0.85 0.15 0.95 -0.15 0.95 -0.05 0.95 0.05 0.95 0.15 1.05 -0.15 1.05 -0.05 1.05 0.05 1.05 0.15 1.15 -0.15 1.15 -0.05 1.15 0.05 1.15 0.15 |
Probably you want to calculate strain in nodes of some rectangular grid. In this case, you may generate the file input.dat by the following simple program: make_grid2d.exe (source code: make_grid2d.c). For example, the file input.dat listed above can be created by the following command:
make_grid2d.exe 0.85 0.1 1.15 -0.15 0.1 0.15 input.dat
The program make_grid2d demands 7 arguments. The first 3 arguments are minimum value of x-coordinate, grid spacing in x, and maxinum value of x. Next 3 arguments are the same for y. Finally, the last argument is a name of a file to be created.
For the sake of safety, make_grid2d generates no more than one million grid points.
File output.dat is the result of the program's work. It contains all the data from input.dat, but 4 new numbers are added at the end of each line. The first number is 1 if the point belongs to the inclusion, and 0 otherwise. Second, third, and fourth numbers are xx-, yy-, and xy-components of calculated strain tensor, correspondingly.
For example, the command "easystrain2d.exe struct.txt input.dat output.dat" creates, from files struct.txt and input.dat listed above, the file output.dat containing the following:
0.85 -0.15 0.00 -0.004832 0.004832 -0.004027 0.85 -0.05 0.00 -0.006686 0.006686 -0.003110 0.85 0.05 0.00 -0.007693 0.007693 -0.000853 0.85 0.15 0.00 -0.007096 0.007096 0.001221 0.95 -0.15 0.00 -0.004687 0.004687 -0.006210 0.95 -0.05 0.00 -0.008658 0.008658 -0.006391 0.95 0.05 0.00 -0.011582 0.011582 -0.000222 0.95 0.15 0.00 -0.008771 0.008771 0.002903 1.05 -0.15 0.00 -0.002903 0.002903 -0.008477 1.05 -0.05 0.00 -0.004845 0.004845 -0.012608 1.05 0.05 0.00 -0.014375 0.014375 0.006869 1.05 0.15 0.00 -0.009540 0.009540 0.006021 1.15 -0.15 0.00 -0.000246 0.000246 -0.009291 1.15 -0.05 0.00 0.000053 -0.000053 -0.012350 1.15 0.05 1.00 -0.038037 0.024703 -0.015631 1.15 0.15 0.00 -0.008630 0.008630 0.009060 |
Here I should repeat many of written above, because the three-dimensional case has much in common with two-dimensional one.
File struct.txt can look like this:
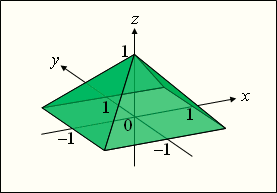
_[ Example: an inclusion in the shape of a pyramid (see the picture below). _] _vertices 5 _[ Total number of vertices. _] @1 -1 -1 0 _[ After the symbol @, a number of the next vertex is indicated _] @2 1 -1 0 _[ (without a whitespace), then its three coordinates (x y z) follow. _] @3 1 1 0 _[ Vertices can appear in the file in arbitrary order. _] @4 -1 1 0 @5 0 0 1 _faces 5 _[ Total number of faces. _] @1 1 2 5 _[ After the symbol @, a number of the next face is indicated _] @2 2 3 5 _[ (without a whitespace), then numbers of its vertices follow _] @3 3 4 5 _[ (in their order---either clockwise or counter-clockwise). _] @4 4 1 5 _[ Faces can appear in the file in arbitrary order. _] @5 1 2 3 4 _eps0 0.067 _[ Lattice mismatch _] _Poisson 0.28 _[ Poisson ratio _] _end After the word "_end", any text may be written---it will be ignored. The file consists of words separated by whitespaces, tabs, end-of-lines. It does not matter how many whitespaces, etc. are placed between words. It is not important also how the file is broken into lines. Comments can be inserted in any place of file. Each comment begins with the word "_[", and ends with the word "_]". Coordinates can be measured in any units (centimeters, nanometers and so on), the choice of units does not influence on the result (because strain tensor is dimensionless). Lattice mismatch is defined as (A_inclusion - A_matrix) / A_matrix, where A_inclusion and A_matrix are lattice constants of the inclusion and the matrix. |

File input.dat contains three columns of numbers. The first column is x-coordinates of points, the second is y-coordinates, the third is z-coordinates. Each row corresponds to one point (x,y,z), where strain tensor is to be calculated. For example:
0 0 0.5 0 0 1.5 0 1 0.5 0 1 1.5 1 0 0.5 1 0 1.5 1 1 0.5 1 1 1.5 |
Probably you want to calculate strain in nodes of some rectangular grid. In this case, you may generate the file input.dat by the following simple program: make_grid3d.exe (source code: make_grid3d.c). For example, the file input.dat listed above can be created by the following command:
make_grid3d.exe 0 1 1 0 1 1 0.5 1 1.5 input.dat
The program make_grid3d demands 10 arguments. The first 3 arguments are minimum value of x-coordinate, grid spacing in x, and maxinum value of x. Next 3 arguments are the same for y, and next 3 arguments are the same for z. Finally, the last argument is a name of a file to be created.
For the sake of safety, make_grid3d generates no more than one million grid points.
File output.dat is the result of the program's work. It contains all the data from input.dat, but 7 new numbers are added at the end of each line. The first number is 1 if the point belongs to the inclusion, and 0 otherwise. The next 6 numbers are xx-, yy-, zz-, xy-, xz-, and yz-components of calculated strain tensor, correspondingly.
For example, the command "easystrain3d.exe struct.txt input.dat output.dat" creates, from files struct.txt and input.dat listed above, the file output.dat containing the following:
0 0 0.5 1.00 -0.032439 -0.032439 -0.017011 0.000000 0.000000 0.000000 0 0 1.5 0.00 0.004990 0.004990 -0.009980 0.000000 0.000000 0.000000 0 1 0.5 0.00 0.007997 -0.013977 0.005981 0.000000 0.000000 -0.012409 0 1 1.5 0.00 0.002587 0.000035 -0.002622 0.000000 0.000000 -0.003708 1 0 0.5 0.00 -0.013977 0.007997 0.005981 0.000000 -0.012409 0.000000 1 0 1.5 0.00 0.000035 0.002587 -0.002622 0.000000 -0.003708 0.000000 1 1 0.5 0.00 -0.001595 -0.001595 0.003189 -0.007372 -0.003990 -0.003990 1 1 1.5 0.00 0.000468 0.000468 -0.000937 -0.001290 -0.001850 -0.001850 |
As one more example, let's consider how strain distribution pictures, shown at the main page, was created:
1. The text listed above was saved as struct.txt.
2. With the program make_grid3d, the file input.dat was created:
make_grid3d.exe -2 0.02 2 0 1 0 -1 0.02 2 input.dat
Note that minimum and maximum values of y are the same. It means that there is only one value of y, i. e. actually we created a two-dimensional grid (at the section y=0).
3. The program easystrain3d was launched:
easystrain3d.exe struct.txt input.dat output.dat
As a result, the file output.dat has appeared. It contains 10 columns of numbers. 1st and 3rd columns are x- and z-coordinates; 2nd column (y-coordinates) consists of zeros. In 5th, 6th, 7th, and 9th columns there are calculated values of xx-, yy-, zz-, and xz-components of strain tensor. 8th and 10th columns are zeros, because xy- and yz-components of strain vanish in the section y=0.
4. The data from the file output.dat was imported in the program Surfer, and isolines of four components of strain was plotted.